Food Automation Statistics
Food automation is no longer driven by innovation for innovation’s sake. It is being driven by pressure—labor shortages, rising compliance demands, SKU complexity, and shrinking margins. Manufacturers aren’t asking if they should automate anymore. They’re asking where, how fast, and what delivers ROI without breaking operations.
The answer, backed by industry data, is increasingly clear: packaging and end-of-line automation sit at the center of food automation growth.
This guide consolidates the most relevant food automation statistics from industry surveys, market forecasts, and regional analyses—then goes a step further. Instead of repeating generic trends, it explains why the numbers look inconsistent, where adoption is actually happening, and how manufacturers are using automation data to make decisions.
Food Automation Statistics: The Current Landscape
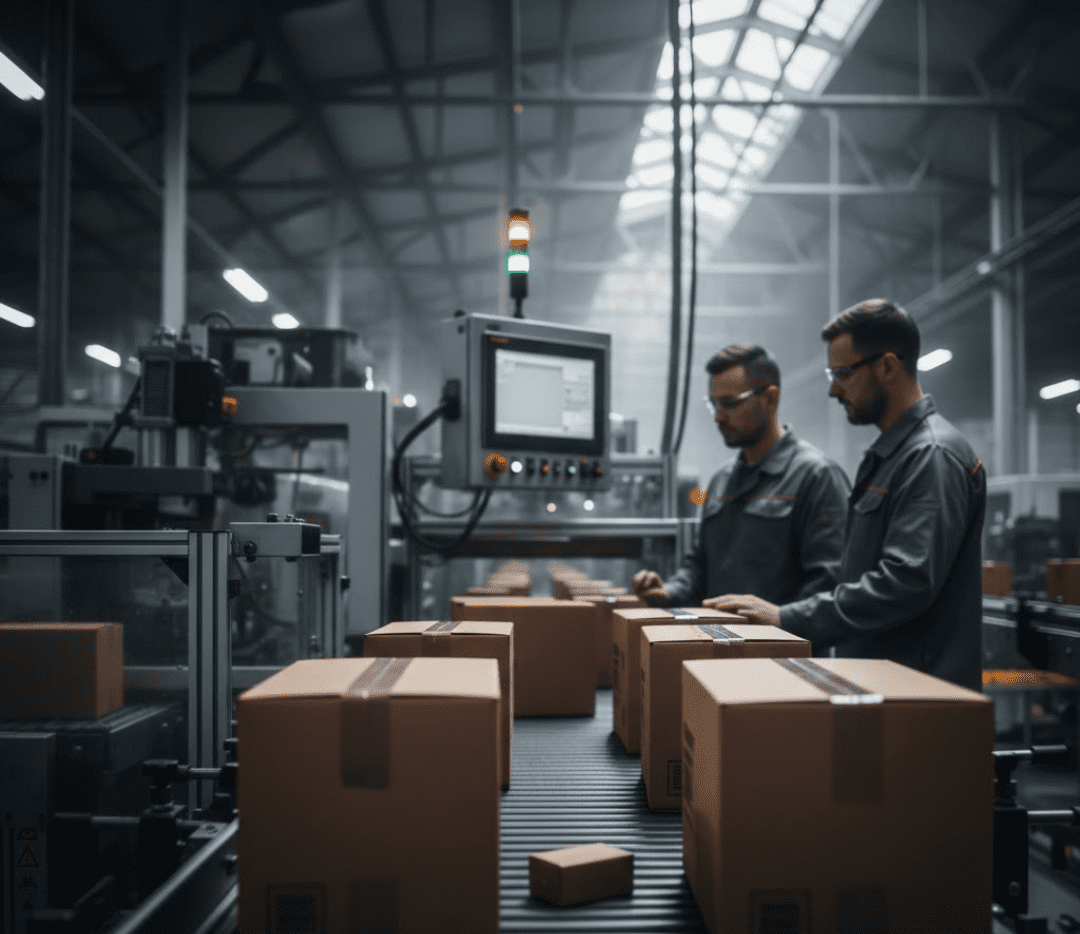
Food automation adoption has accelerated rapidly over the past several years, driven less by technological novelty and more by structural pressure inside food manufacturing operations. Labor availability has become increasingly volatile, regulatory scrutiny continues to tighten, and production lines are expected to handle more SKUs with less downtime. Against this backdrop, automation has shifted from a long-term efficiency initiative to an immediate operational necessity.
Across industry surveys, market research, and capital planning data, several food automation statistics appear consistently. While individual market-size forecasts vary depending on scope and methodology, these adoption benchmarks provide a reliable snapshot of how food manufacturers are allocating capital and prioritizing automation initiatives today.
Investment and Adoption Benchmarks
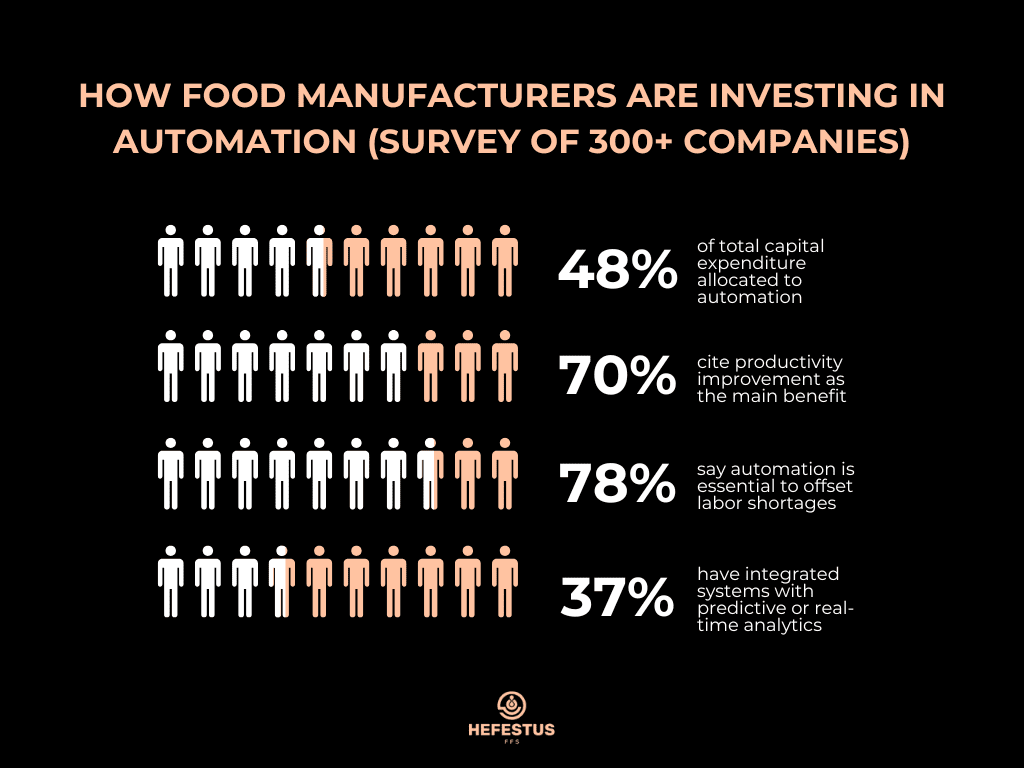
Based on survey data collected from 300+ food and beverage manufacturers across processing, packaging, and distribution operations:
- 48% of total capital expenditure is currently allocated to automation projects, including new installations, upgrades, and expansions
- 70% of respondents cite productivity improvement as the primary benefit driving automation investments
- 78% report that automation is essential to offset labor shortages, particularly in packaging, inspection, and material handling roles
- Only 37% indicate that their plants currently operate with integrated systems and predictive or real-time analytics
These numbers reveal a critical pattern: while automation spending is widespread, digital maturity lags significantly behind hardware adoption.
What this tells us:
Nearly half of capital spending is flowing into automation, yet fewer than four in ten plants have the data infrastructure needed to extract long-term value. This digital maturity gap explains why many automation projects plateau after installation.
Global Food Automation Market Size: Why Forecasts Don’t Match
Market size is the most frequently cited—and most frequently misunderstood—food automation statistic. Executives, investors, and vendors often reference a single headline number to justify strategy, yet those numbers routinely conflict across reputable industry reports. This inconsistency is not a sign of poor research; it is a consequence of how broadly the term food automation is defined.
Understanding why forecasts differ is essential for using market data correctly and avoiding false confidence in overly precise figures.
Market Size Estimates From Industry Reports
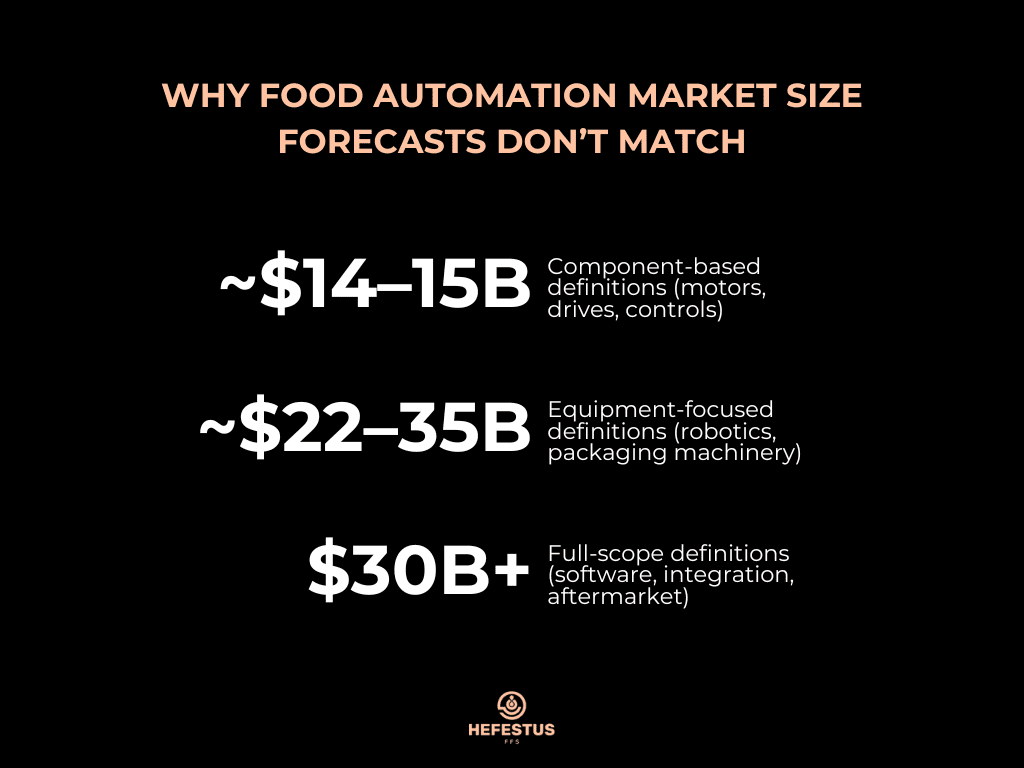
Across leading market analyses, projections for the global food automation market vary widely—even when referencing similar timeframes:
- ~$14–15B market size in the mid-2020s, typically based on narrow, component-focused definitions
- ~$22B in 2023 growing to ~$35B by 2030, reflecting equipment-centric definitions that include robotics and packaging machinery
- $30B+ by the mid-2030s, using broader definitions that incorporate software, system integration, and aftermarket services
All of these estimates can be “correct” within their own frameworks. The problem arises when readers assume they describe the same market in the same way.
Why Market Size Forecasts Diverge
The primary reason forecasts don’t align is that market reports define food automation differently at the structural level:
- Some reports include only motors, drives, and industrial controls
- Others expand the scope to include robotics, packaging equipment, and material handling systems
- Broader analyses also capture software platforms, system integration, analytics, and aftermarket services
Because food automation spans components, machines, and digital layers, even small definitional changes can shift market size totals by billions of dollars.
How to Use Food Automation Market Size Data Correctly
Instead of anchoring strategy to a single headline number, decision-makers should focus on directional and comparative signals that remain consistent across reports:
- The global food automation market is growing steadily, regardless of definition
- Growth is concentrated in packaging, inspection, and material handling, where labor pressure and compliance demands intersect
- Asia-Pacific consistently shows the highest growth rate, driven by greenfield automation and rising packaged-food demand
- Capital is shifting away from one-off machines toward modular, upgradeable, and software-enabled systems
This is why reputable analysts such as Research and Markets place greater emphasis on segmentation, growth drivers, and adoption patterns than on absolute market totals.
What This Means for Manufacturers and Suppliers
Market size statistics are best used as context, not precision tools. They indicate momentum, investment appetite, and long-term direction—but they do not tell you where ROI will materialize first. That insight comes from examining which segments are absorbing capital, which technologies are being deployed fastest, and where operational constraints are most acute.
In practice, these patterns consistently point to packaging and end-of-line automation as the most actionable entry points—regardless of which market size forecast a report promotes.
Food Industry Automation Statistics: Where Capital Is Actually Going
While the term food automation encompasses everything from raw-material handling to palletizing, capital allocation data shows that manufacturers are not spreading investment evenly across the value chain. Instead, spending is concentrating in areas that deliver immediate operational relief, measurable ROI, and minimal disruption to existing processes.
Across surveys, capital plans, and automation roadmaps, a consistent pattern emerges: food manufacturers are prioritizing automation initiatives that stabilize throughput, reduce labor dependency, and improve compliance without requiring fundamental changes to recipes, thermal processes, or sanitation regimes.
Top Automation Investment Categories
Based on reported capital expenditure plans, manufacturers are directing the majority of automation spending toward:
- Automation installations, upgrades, and expansions, including retrofits of existing lines
- Packaging and filling line automation, particularly in high-volume and labor-intensive operations
- Process upgrades, typically secondary to packaging and often limited in scope
- Utilities and infrastructure modernization, such as electrical, controls, and data backbone improvements
- Audits, feasibility studies, and automation consulting, used to de-risk larger capital projects
This distribution reflects a pragmatic approach to automation. Rather than pursuing full plant-wide transformation, manufacturers are targeting specific constraints where automation delivers fast, defensible returns.
Food Packaging Automation Statistics: Why Packaging Leads ROI
Across industry surveys, capital plans, and competitor analyses, packaging automation consistently emerges as the fastest-adopting and most defensible segment of food automation. This is not because packaging is technologically simpler, but because it sits at the intersection of labor pressure, regulatory exposure, and throughput variability—three of the most acute challenges food manufacturers face today.
Unlike upstream processing automation, which often requires recipe validation, sanitation redesigns, and extensive change management, packaging automation can typically be deployed in modular phases. This makes it uniquely well-suited for manufacturers seeking rapid operational relief without introducing disproportionate risk.
Why Packaging Automation Grows Faster Than Processing
Multiple food industry automation studies point to a common set of drivers accelerating packaging adoption:
- Chronic labor shortages in repetitive, physically demanding packaging roles that are difficult to staff and retain
- Rising SKU counts and shorter production runs, increasing the operational cost of manual changeovers
- Regulatory pressure for labeling accuracy and traceability, where even minor errors carry outsized compliance risk
- Growing demand for flexible packaging formats, including pouches, bags, jars, and mixed-format lines
- Reduced contamination risk achieved through lower levels of direct human handling
In addition to these structural drivers, packaging automation is easier to retrofit than most processing equipment. Brownfield plants can often automate filling, sealing, inspection, or end-of-line operations without shutting down upstream processes—an advantage for facilities that cannot afford extended downtime.
Why Packaging Delivers Faster, Clearer ROI
From a financial perspective, packaging automation is easier to justify because its benefits are immediately observable and measurable. Improvements show up directly in production metrics and operating costs, rather than being diluted across complex process interactions.
Packaging automation investments typically deliver ROI through:
- Reduced labor hours per unit
- Lower product giveaway from precise filling and checkweighing
- Improved throughput consistency across shifts
- Fewer labeling, sealing, and inspection-related defects
- Stronger compliance and traceability performance
Because these gains are tightly linked to discrete line functions, they are easier to benchmark, audit, and defend during capital reviews—making packaging automation one of the lowest-friction entry points into broader automation strategies.
Most Commonly Automated Packaging Functions
Food packaging automation statistics show especially high adoption across the following functions:
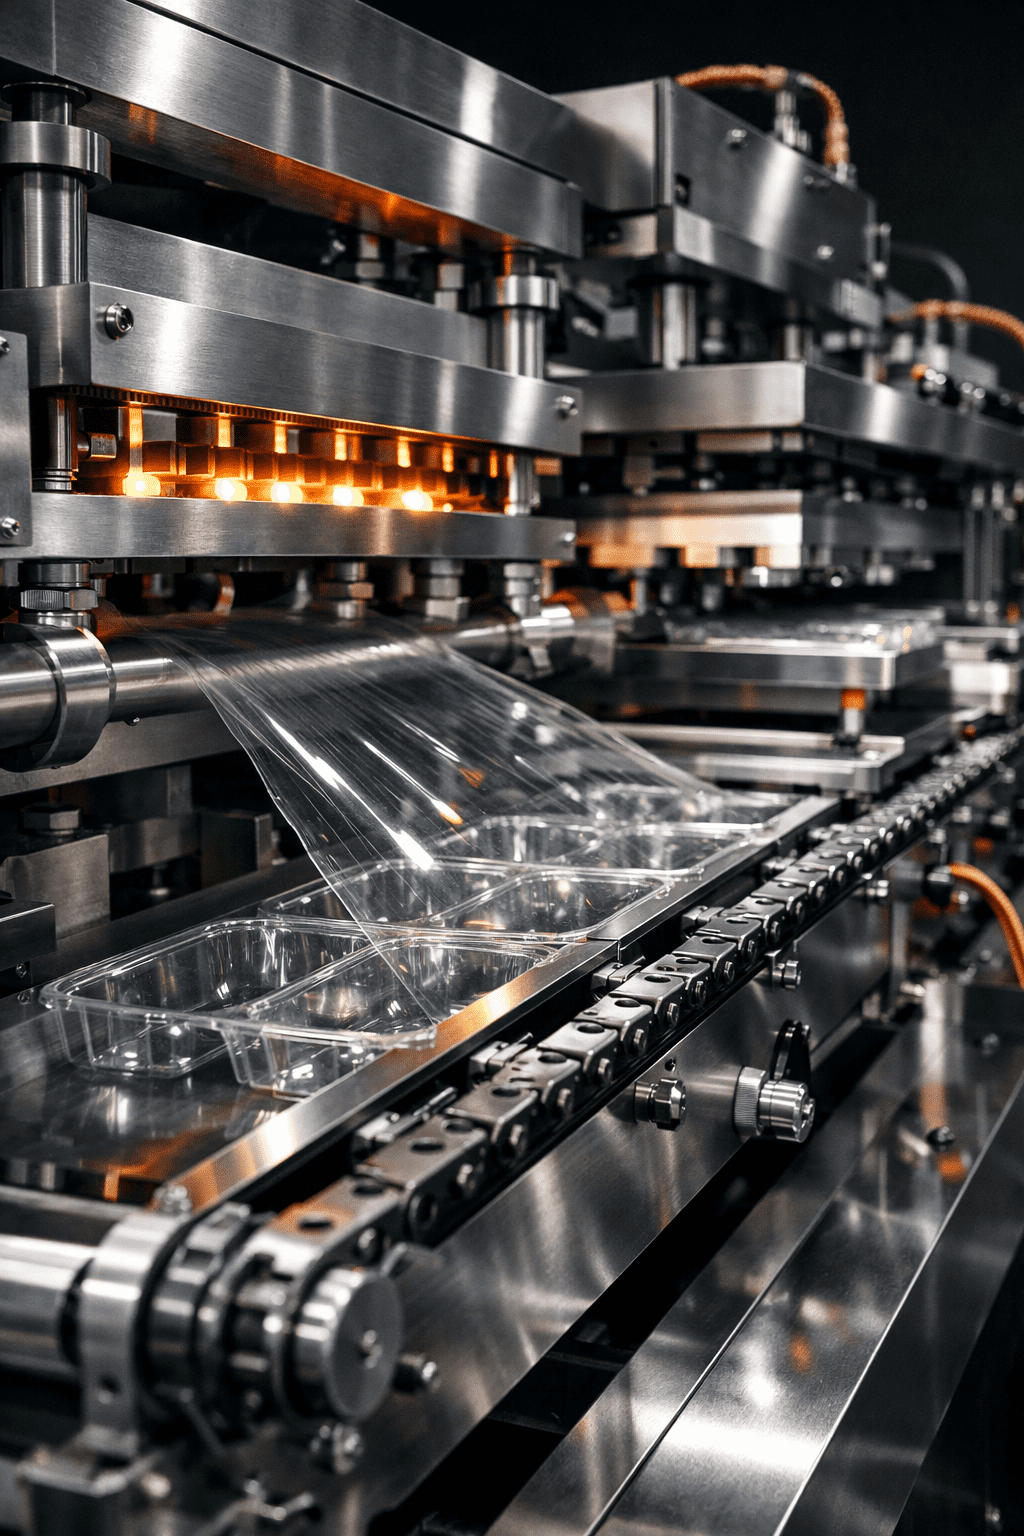
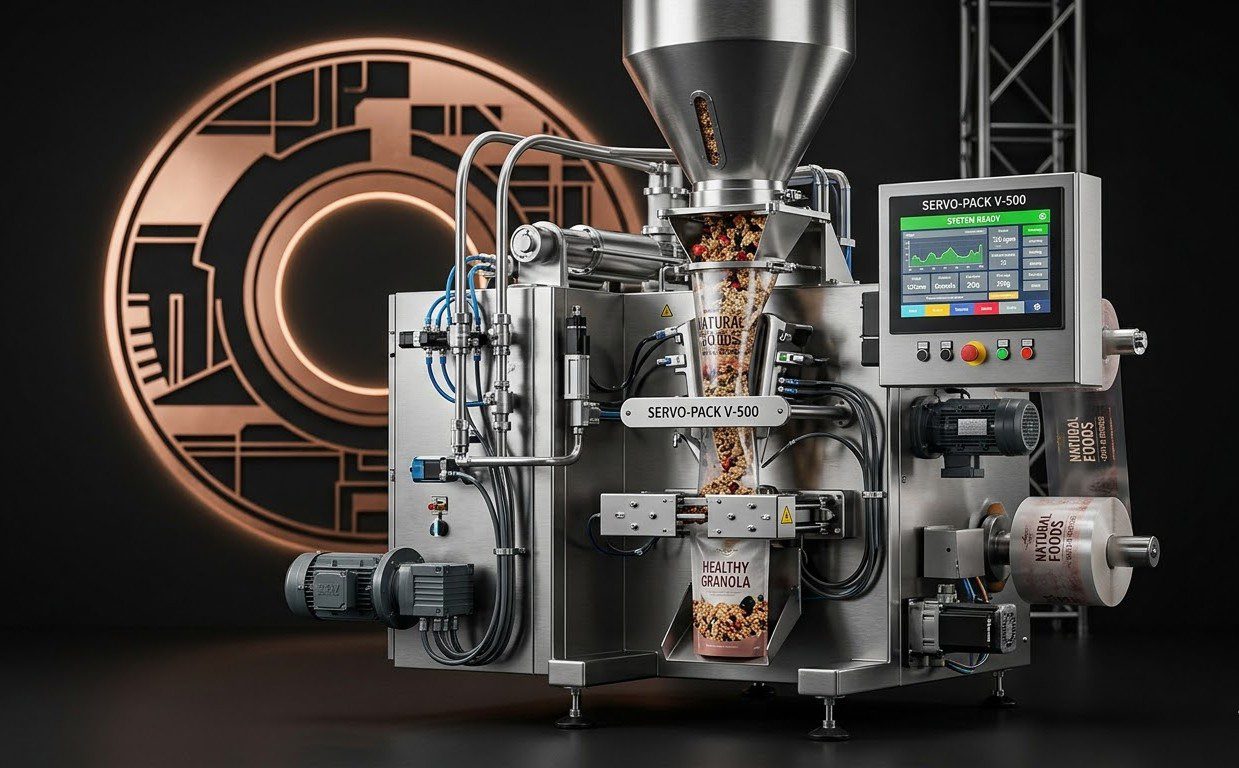
- Form-fill-seal systems (vertical and horizontal)
- Jar, bottle, and tube filling operations
- Sealing and labeling with integrated verification
- Checkweighing and vision inspection for quality and compliance
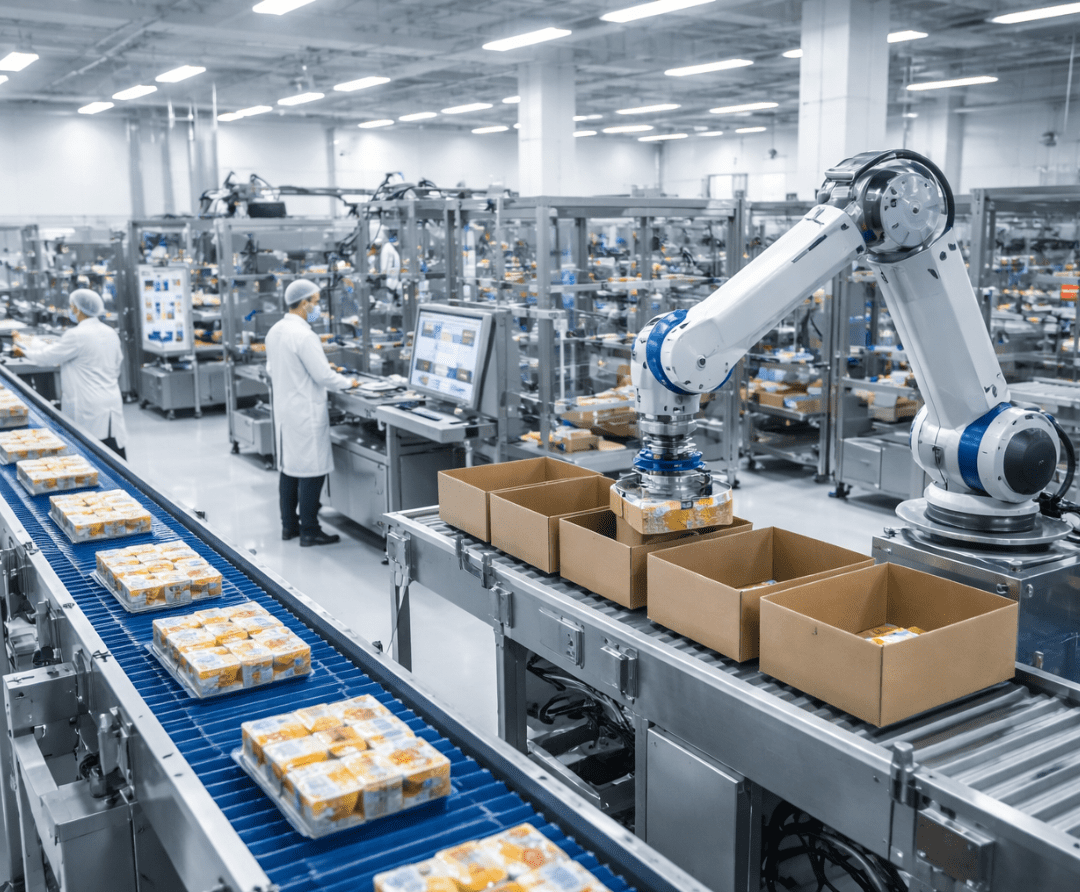
- Case packing and palletizing at end-of-line
Each of these functions directly influences labor cost, throughput stability, and regulatory compliance—three areas where automation impact is both rapid and quantifiable.
What Packaging Automation Adoption Signals About the Industry
The dominance of packaging automation signals a broader shift in how food manufacturers approach automation strategy. Rather than pursuing plant-wide transformation upfront, organizations are starting where automation risk is lowest and value is highest, then expanding outward as digital maturity improves.
In this sense, packaging automation is not just a segment—it is the gateway layer through which most food automation strategies now begin.
ROI Metrics That Actually Matter in Food Automation
Generic claims about “efficiency” are not what win internal buy-in. Plants that succeed track specific metrics.
The Metrics Used to Justify Packaging Automation
- Labor hours per 1,000 units
- Product giveaway (overfill per unit)
- Overall equipment effectiveness (OEE)
- Defect and rework rates
- Changeover time and downtime causes
- Traceability and inspection pass rates
Packaging lines consistently outperform upstream processes on these metrics, which explains why they are automated first.
Automation by Function, Application, and Component
By Function
- Packaging held the largest share of automation investment in the mid-2020s
- Processing automation is expected to grow faster later as digital maturity improves
By Application
- Meat, poultry, and seafood lead adoption due to hygiene requirements and labor intensity
- Dairy shows strong growth due to repeatable processes and high volume
By Component Type
- Motors and generators represent the largest installed base
- Motor controls are among the fastest-growing segments because they span multiple line stages
These patterns explain why some reports emphasize components while others focus on equipment—both can be correct depending on scope.
Regional Food Automation Adoption Trends
Food automation adoption is not uniform across regions. While the underlying drivers—labor pressure, compliance, and productivity—are global, how manufacturers respond varies significantly by geography. These regional differences influence not only the pace of adoption, but also the types of automation technologies being prioritized and the way projects are deployed.
Understanding these patterns is critical for selecting automation strategies that align with local labor markets, regulatory environments, and capital constraints.
North America
Food manufacturers in North America show strong adoption of packaging and end-of-line retrofits, particularly in existing facilities where downtime carries high financial risk. Rather than replacing entire production lines, organizations favor modular automation systems that can be integrated incrementally and expanded over time.
Labor availability is consistently cited as the primary automation catalyst in this region. Chronic shortages in packaging, inspection, and material handling roles have pushed manufacturers to prioritize automation that stabilizes throughput and reduces dependence on hard-to-fill positions, even when wage pressure is less severe than in other regions.
Europe
In Europe, food automation adoption is shaped heavily by traceability, compliance, and sustainability requirements. Regulatory frameworks place a strong emphasis on product labeling accuracy, batch-level traceability, and contamination prevention, accelerating the adoption of inspection, vision-based quality control, and data capture systems.
European manufacturers also tend to incorporate sustainability objectives directly into automation design, favoring systems that reduce waste, improve energy efficiency, and support circular packaging initiatives. As a result, automation projects in this region often prioritize compliance and environmental performance alongside productivity gains.
Asia-Pacific
Asia-Pacific represents the fastest-growing food automation market globally, driven by rapid urbanization, rising demand for packaged foods, and large-scale capacity expansion. Unlike North America and parts of Europe, many facilities in this region are greenfield plants, designed with automation as a baseline rather than as a retrofit.
Investment in robotics, smart factories, and digitally integrated production lines is particularly strong, enabling manufacturers to scale quickly while maintaining consistency across high-volume operations. These conditions allow Asia-Pacific manufacturers to leapfrog incremental automation stages that are common in older facilities elsewhere.
Key takeaway:
These regional differences reinforce the need for flexible, scalable automation strategies that can adapt to local constraints rather than assuming a one-size-fits-all deployment model.
Technology Trends Reshaping Food Automation
Beyond regional differences, food automation is being reshaped by a set of technology trends that are changing how systems are designed, justified, and expanded. These shifts reflect a move away from isolated machines toward connected, data-driven automation ecosystems.
Industry reports consistently highlight several developments that are redefining best practices.
Core Technology Shifts
- Vision-based inspection systems are increasingly replacing manual quality checks, improving accuracy while reducing labor dependency and compliance risk.
- Predictive maintenance, enabled by connected equipment and sensor data, is gaining traction as manufacturers seek to reduce unplanned downtime and maintenance costs.
- Software-driven changeovers are reducing friction caused by rising SKU counts, allowing faster transitions between products without sacrificing throughput.
- Robotics-as-a-Service (RaaS) models are lowering capital barriers by shifting automation costs from upfront investment to operating expense structures.
Organizations such as the McKinsey Global Institute estimate that automation could contribute 0.8–1.4% annual GDP growth across manufacturing, including food and beverage. This projection underscores why manufacturers are increasingly viewing automation as a strategic growth lever rather than a narrow efficiency tool.
Barriers That Still Slow Automation Adoption
Despite strong momentum, food automation adoption continues to face obstacles that are often understated in market reports. While high upfront investment and system integration complexity are frequently cited, operational data reveals deeper, more persistent challenges.
Common Adoption Barriers
- Integration debt between machines, lines, and legacy systems, which limits scalability
- Insufficient internal maintenance capability, increasing reliance on external support
- Operator distrust of automated systems, often driven by poor change management
- Lack of reliable baseline data, making ROI difficult to measure or defend
- Automation of unstable processes, which amplifies inefficiencies rather than resolving them
These barriers explain why automation success depends as much on organizational readiness and sequencing as it does on technology selection. Plants that fail to address these issues often see diminishing returns after initial deployment.
A Packaging-First Automation Roadmap
Manufacturers that consistently succeed with automation tend to follow a phased, packaging-first approach rather than attempting full plant transformation upfront. This strategy aligns closely with food automation statistics showing packaging as the fastest-adopting and lowest-risk entry point.
Typical Phased Approach
Phase 1: Instrument and baseline performance
Establish reliable metrics for throughput, downtime, defects, and labor utilization.
Phase 2: Automate packaging and end-of-line
Deploy filling, sealing, inspection, and palletizing automation where ROI is immediate and measurable.
Phase 3: Add analytics and predictive maintenance
Leverage connected systems to reduce downtime and support continuous improvement.
Phase 4: Expand automation upstream into processing
Apply automation to more complex processes once data maturity and operational stability are in place.
This roadmap reflects a pragmatic approach to automation that balances speed, risk, and long-term scalability.
Why Food Automation Statistics Matter
Market size forecasts vary and definitions differ, but the operational reality is remarkably consistent across regions and segments:
- Automation spending is accelerating
- Packaging automation leads adoption
- Data maturity lags behind hardware deployment
- Modular, upgradeable systems outperform rigid production lines
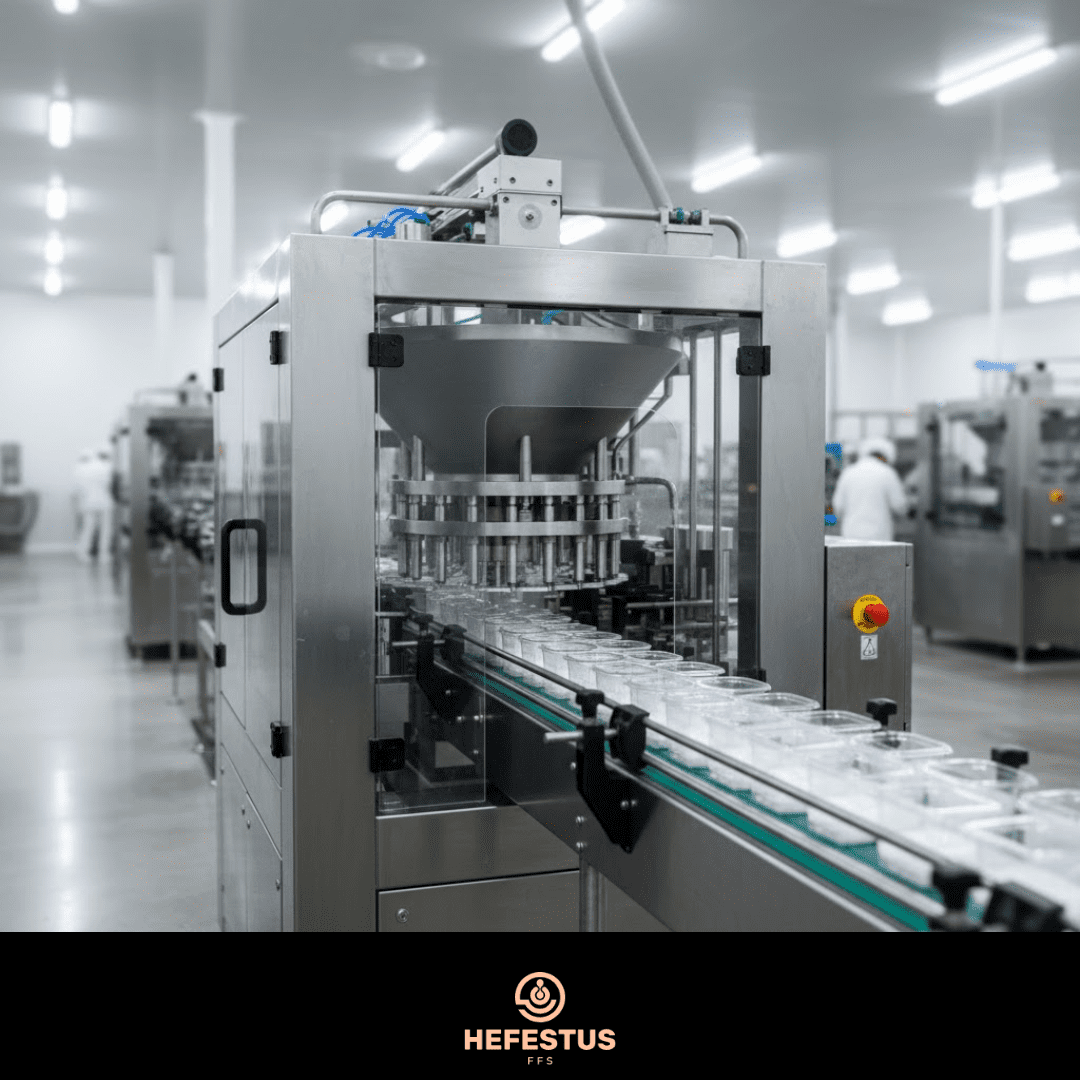
For technology providers like Hefestus, these statistics reinforce a clear market truth: filling and packaging automation is where demand, ROI, and urgency intersect. Understanding and applying these data points correctly allows manufacturers and suppliers alike to move beyond trend-following and toward durable competitive advantage.
Conclusion: The Most Important Statistic Isn’t Market Size
The most important food automation statistic isn’t how big the market is—it’s where value concentrates. Today, that value is concentrated in packaging, inspection, and end-of-line automation, supported by data and designed for flexibility.
Manufacturers that treat automation as a phased, metrics-driven strategy—not a single capital project—are the ones positioned to win.
If this guide was useful, share it with your operations or engineering team, or explore related resources on modular packaging automation and line integration.
Sources
- CRB – New report: Automation beyond food and beverage industry trends – https://www.crbgroup.com/insights/food-beverage/automation-ai-food-and-beverage-report
- Food Industry Executive – Automation Investments Boost Productivity and Profits in Food Manufacturing – https://foodindustryexecutive.com/2025/05/automation-investments-boost-productivity-and-profits-in-food-manufacturing/
- Markets and Markets – New Market Reports – https://www.marketsandmarkets.com/new-reports.asp
- NMSC – Packaging Robots Market Source – https://www.nextmsc.com/report/packaging-robots-market – https://www.nextmsc.com/report/packaging-robots-market
- MDPI – Automation and Optimization of Food Process Using CNN and Six-Axis Robotic Arm – https://www.mdpi.com/2304-8158/13/23/3826
- Market Research Future – Food Automation Market – https://www.marketresearchfuture.com/reports/food-automation-market-32646
- Statista – Food Industry Robotics – Worldwide – https://www.statista.com/outlook/tmo/robotics/industrial-robotics/food-industry-robotics/worldwide